Home < Technical < Product Overview < Autocomplete Analytics
Autocomplete Analytics
Prefixbox search box analytics provide an easy way to understand how your users interact
with the search box and help you understand whether the configuration and data changes you
are making to your search box improve the search experience or not.
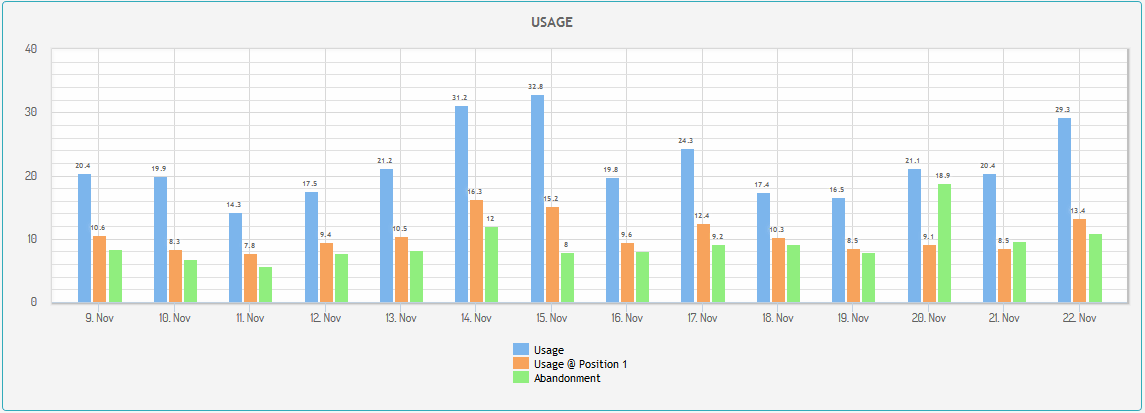
The metrics are calculated daily and you can see the historical trends for each metric.
The following analytics dashboards are available in the Prefixbox Portal for all of your search boxes.
Search box overview
Generally speaking, we want to increase the suggestion usage and reduce the search box abandonment.
Position 1 Usage gives an indication about the ranking quality of the suggestions. Our daily
suggestion refresh mechanism helps you improve the suggestion usage by ranking more relevant
suggestions higher automatically.
The user selected one of the suggestions when executing the search.
Increasing the suggestion usage is a good thing because we can save
time for the users and the Search Result Pages usually have higher
quality when the users execute their searches through the suggestions.
The percentage of searches that were executed by selecting the suggestion at Position 1.
The first suggestion has the highest usage among all the positions. This is known as
Position Bias which is common in recommendation engines. In case of e-commerce websites
we can take advantage of the Positional Bias and show certain products or product
categories at higher positions to increase revenue.
The user focused into the search box but did not execute the search. High abandonment
rates can indicate issues with the suggestion quality. It can also happen due to incorrect analytics tracking.
Coverage analytics help you understand how much your search box is able to show suggestions when
users type and execute their searches. Conditional Usage tells you whether those suggestions
were engaging to the users.
The daily suggestion list refresh helps in improving the coverage by adding more
relevant suggestions to your suggestion lists based on your users’ previous searches.
Measures whether at the time of formulating the search
query there were any suggestions shown to the user.
Measures whether at the time of search query execution there were any suggestions shown to the user.
Happens when the user selected one of the offered suggestions, given that the search box was
able to show suggestions. There is a difference in the definition of Usage and Conditional
Usage: Usage does not consider whether suggestions were available or not.
Autocomplete suggestions help users save some of typing. We want to suggest the best suggestion
even when the user did not type much (i.e.: minimize the Pattern Length). Intent
Expression Time is a bit harder to reduce because it takes some time for users to
read the suggestions, though it is important to track.
The average of the executed search keyword lengths. Search execution
can happen by clicking on a suggestion or by submitting the search keyword.
The average typed characters by the user for each search. It gives an indication
of the effort users have to make to formulate their search query.
The average seconds users spend on formulating their queries, expressing their intent.
For abandoned searches we default the Intent Expression Time to 15 sec. If the Search Box
Abandonment is too high it can skew the Intent Expression Time.
Search box audience
Increasing the Search User rate is important because users who search have higher engagement levels.
Searching on e-commerce websites significantly increases the chance of purchasing a product.
High quality search experience increases the Search User rate over time.
The average number of searches executed by users who used this search box.
The percenage of users who searched out of the overall visitors.
In order to deep dive into the above relative metrics you can monitor the absolute number of Searches and Search Users
The number of search queries executed using this search box.
Every search is included even if the same user executed the same search multiple times.
The number of unique search queries executed using this search box.
A repeated search during a single visit is counted only once.
The number of users who used this search box. Focusing into the search box is enough to be considered.
The number of page views where this
search box was present. Multiple views of the same page
during the same visit are counted only once.
The number of users who have visited pages where this search box was present.
The number of new users who visited pages where this search box was present.
We consider users new if we have not seen them in the past 60 days.
The number of returning users who visited pages where this search box was present.
We consider users as returning users if we have seen them in the past 60 days.
Search box performance
You can monitor the performance of your search boxes near real time (with 5 minutes delay).
It helps you understand how much load the search box gets and how fast it is able to serve the requests.
If a search box is available in multiple data centres, you can check its performance in each data centre.
The number of search / lookup requests for the search box in the reported interval.
Most keystrokes in the search box will create a new lookup request unless the user types very fast.
Lookup Queries per Second. The rate of lookup requests in a second.
The average server side latency of serving lookup requests. The latency is measured in milliseconds.