25 Essential Ecommerce KPIs to Improve Business Performance
If you want to improve business performance but don’t know where to begin, Ecommerce KPIs are a great place to start.
Ecommerce KPIs help companies discover room for improvement and determine if they’re progressing toward their goals.
Many KPIs offer insight into different areas of your business, so it’s important to outline your specific objectives when choosing which ones to track.
In this article, we:
- Explain what KPIs are
- Discuss how to choose the right KPIs
- List 25 useful KPIs to maximize business performance
Let’s jump in!
TABLE OF CONTENTS
- What are Ecommerce KPIs?
- Why are Ecommerce KPIs Important?
- The Difference Between KPIs and Metrics
- How to Create Impactful KPIs
- 25 Essential Ecommerce KPIs for Maximum Business Performance
- 1. Customer Acquisition Cost (CAC)
- 2. Average Order Value (AOV)
- 3. Conversion Rate
- 4. Cost Per Acquisition (CPA)
- 5. Customer Lifetime Value (CLV)
- 6. Zero Result Rate (ZRR)
- 7. Average Cart Abandonment Rate
- 8. Branded Online Search Impressions
- 9. Customer Churn Rate
- 10. Gross Profit Margin
- 11. Conversion Rate Per Traffic Channel
- 12. Customer Retention Rate (CRR)
- 13. Add-to-Cart Rate
- 14. Repeat Purchase Rate (RPR)
- 15. Purchase Frequency
- 16. Average Purchase Revenue Per Visitor
- 17. Cost Performance Index (CPI)
- 18. Return on Investment (ROI)
- 19. Return on Ad Spend (ROAS)
- 20. Email Signup Conversion Rate
- 21. Website Traffic
- 22. Time to Purchase
- 23. Repeat Visits
- 24. Bounce Rate
- 25. Referral Traffic
- How often should you track your Ecommerce KPIs?
- Conclusion
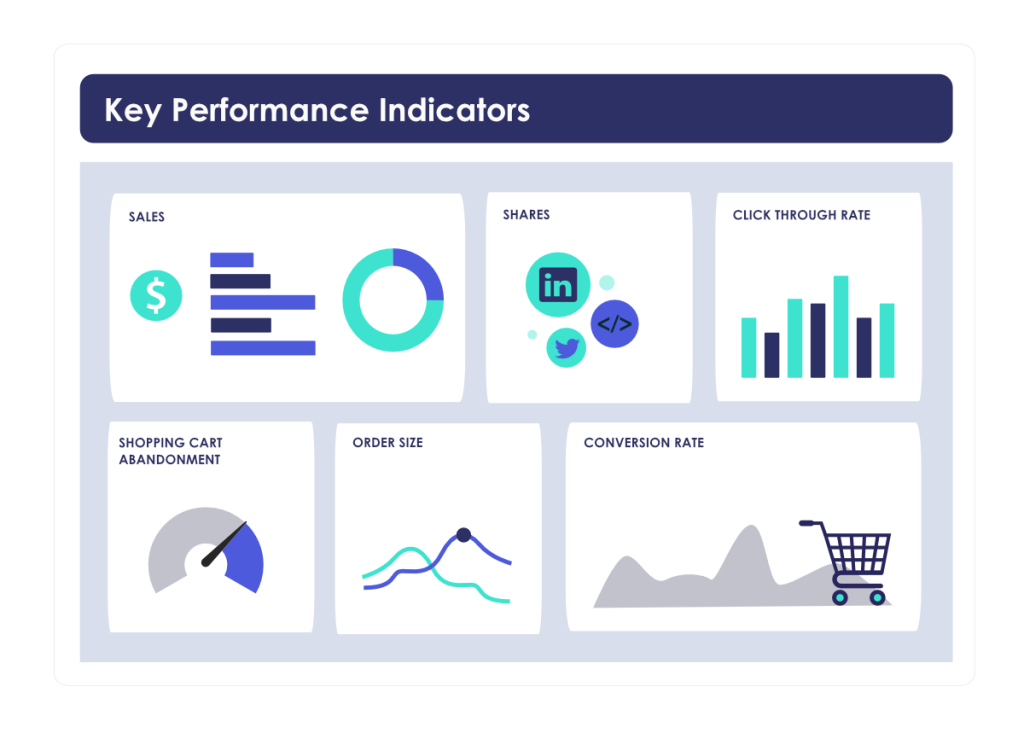
What are Ecommerce KPIs?
Ecommerce KPIs are key performance indicators, quantifiable measurements that indicate business performance. KPIs help track progress in many aspects of your business: sales, marketing, customer service, and more.
Identifying areas for improvement and choosing relevant KPIs is the first step toward achieving your business goals.
Why are Ecommerce KPIs Important?
Ecommerce KPIs show how an online business progresses over time. KPIs are used to set goals, track customer behavior, monitor business performance, and determine progress.
If your online store isn’t performing how you’d like, tracking KPIs can help alert you to the heart of the problem (like these common online shopping problems), so you can take steps to address it.
Discovering pain points and creating KPIs can help your company formulate business strategies and make better decisions.
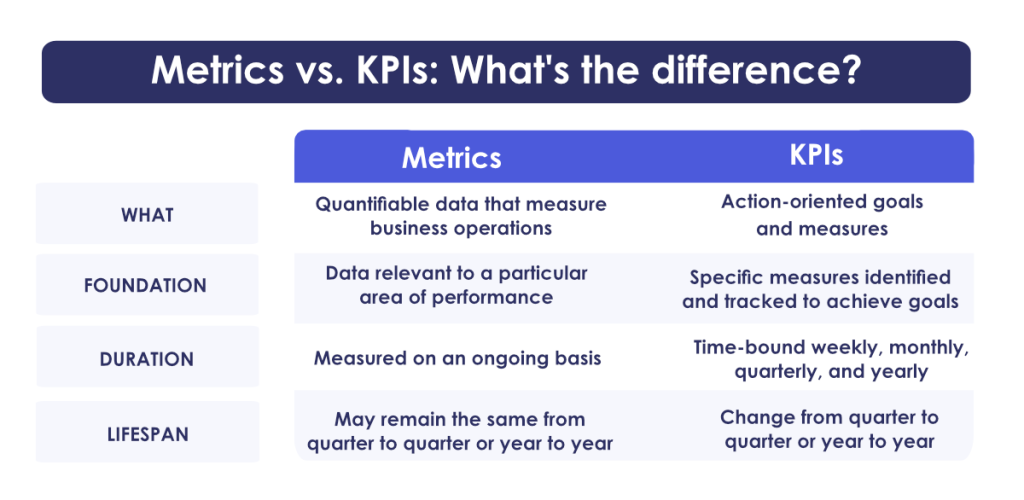
The Difference Between KPIs and Metrics
Metrics are units of measurement that show overall business health. KPIs are the most relevant metrics.
When a business chooses the right KPIs and tracks them correctly, they receive actionable insight that can inform effective strategies.
If you’re still struggling to differentiate metrics and KPIs, we’ve outlined some of the distinctions.
Now that you understand the differences between KPIs and metrics, let’s dive into how you can create them.
How to Create Impactful KPIs
When deciding which KPIs to track, you’ll want to choose metrics that:
- Provide actionable insight
- Offer accurate measurements
- Deliver data instantaneously
These attributes will show if your day-to-day decisions and operations are effectively helping achieve your objectives.
That said, numerous KPIs check these boxes.
So, how do you know which KPIs are best for your Ecommerce business? Follow these steps to identify the ones that work for you.
Pinpoint Room for Improvement
To find the right KPIs, you should first decide which part of your business you want to improve.
Here are some examples:
- Sales
- Marketing
- Store Performance
- Customer Service
If the suggestions above don’t align with your specific goals, don’t worry. Choose categories that best suit you.
Once you identify where you’d like to make the most impact, you’re ready to move on to the next step.
Identify Your Goals
Next, hone in on your specific goals. Your goals will dictate which part of your business you should monitor and which KPIs will be most beneficial.
Let’s take a look at how identifying specific goals can help you choose the right KPIs.
Ecommerce Goal #1
If your main goal for the year is to increase traffic to your Ecommerce store, you may want to track:
- Ecommerce Site Traffic
- Marketing Conversion
- Social Media Engagement
Ecommerce Goal #2
If you want to increase overall revenue, KPIs that can help achieve this are:
- Average Order Value
- Conversion Rate
- Zero Result Search Rate
As you can see, the right KPIs for your business will be determined by your unique objectives, so it is crucial to identify them first.
Once you’ve honed in on your area of interest and found a few suitable metrics, let’s see how you can narrow down the KPIs that work best for you.
Choose KPIs that Offer Meaningful Information
You’ll want to ensure your KPIs provide necessary and meaningful information for your business.
We recommend selecting KPIs that have the following attributes.
Based on Historical Data
Analytics based on historical data will help you discover areas you’d like to improve and help you track progress over time.
Historical data will alert your business to patterns and trends so you can set realistic goals, focus your attention on the right areas, create a baseline for comparison, and effectively monitor progress.
Use historical data to your advantage by creating KPIs relevant to your business, then map out an actionable plan to address them.
Collectively Measure Growth
There are many KPIs to track growth: overall revenue, average cart value, number of visitors, and more.
We recommend picking more than one to give you a complete picture of your business’s growth.
These KPIs will help you benchmark performance, focus on continuous improvement and make more informed decisions.
Establish Concrete Goals
Lastly, as we mentioned, when creating a KPI, you’ll want to make sure your goals are clear and concrete.
Concrete goals provide clarity and focus, and they allow progress to be tracked over time.
For example, let’s say you want to focus on marketing. Concrete marketing goals can vary depending on your business but may include increasing sales, boosting website traffic, or achieving ROI on Ad campaigns.
Key performance indicators provide a basis for setting targets and performance benchmarks, so ensuring they establish concrete goals is an effective way to drive improvement.
Choose the Right KPIs for Your Business
Now that you know how to assess your business goals and decide on a few target areas, you’re ready to choose the KPIs that best address them.
If you need some ideas, here are 25 different Ecommerce KPIs you can use to improve business performance.
25 Essential Ecommerce KPIs for Maximum Business Performance
To help you choose the right KPIs for your business, we’ve compiled a list of 25 useful metrics, discussed their impact, and explained how to track them.
Let’s get started!
1. Customer Acquisition Cost (CAC)
CAC is the average cost of acquiring a customer. This KPI shows how effective advertising campaigns and investments are.
To find CAC, track your marketing efforts by channel (advertisements, SEO, etc.) and divide the total spent in each category by the number of new customers acquired via that specific channel.
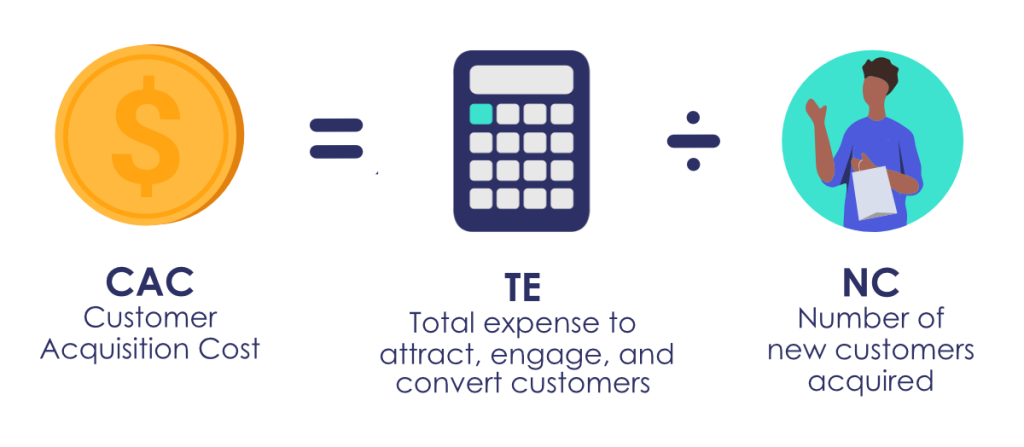
Tracking CAC can highlight which marketing channels are most effectively generating sales.
That said, it’s important to keep in mind that customers may have been drawn to your business by the combined effort of many channels rather than one customer acquisition campaign.
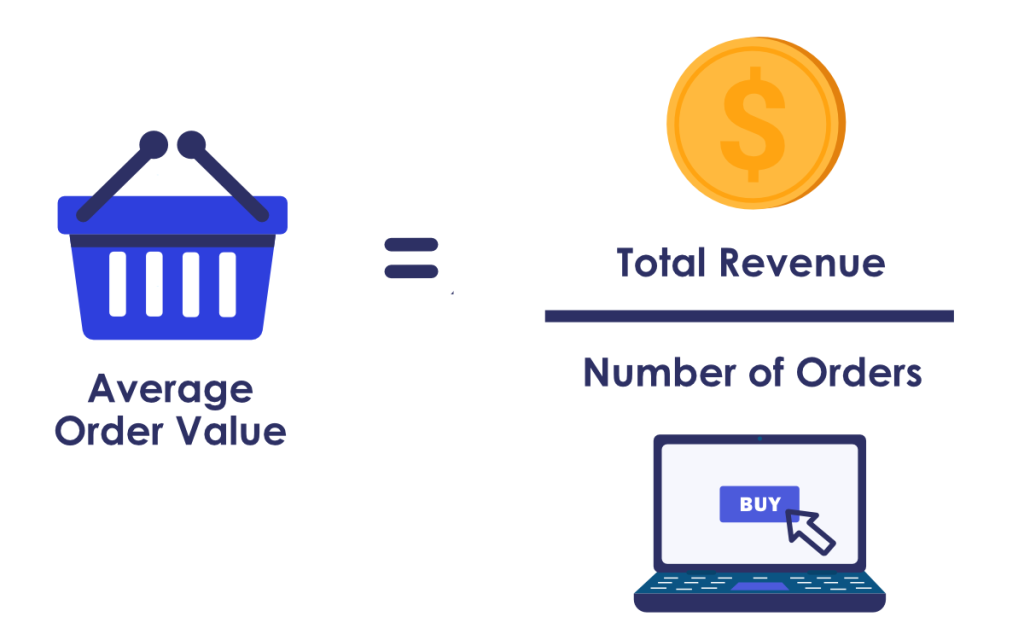
2. Average Order Value (AOV)
AOV is the average amount shoppers spend on a purchase at one time. You can find this retail performance metric by dividing your store’s total revenue by the number of shoppers who make purchases over a set period of time.
You may have considered trying to increase total orders rather than average order value. However, it is generally more lucrative to encourage shoppers already in your store to purchase additional items rather than to attract new business.
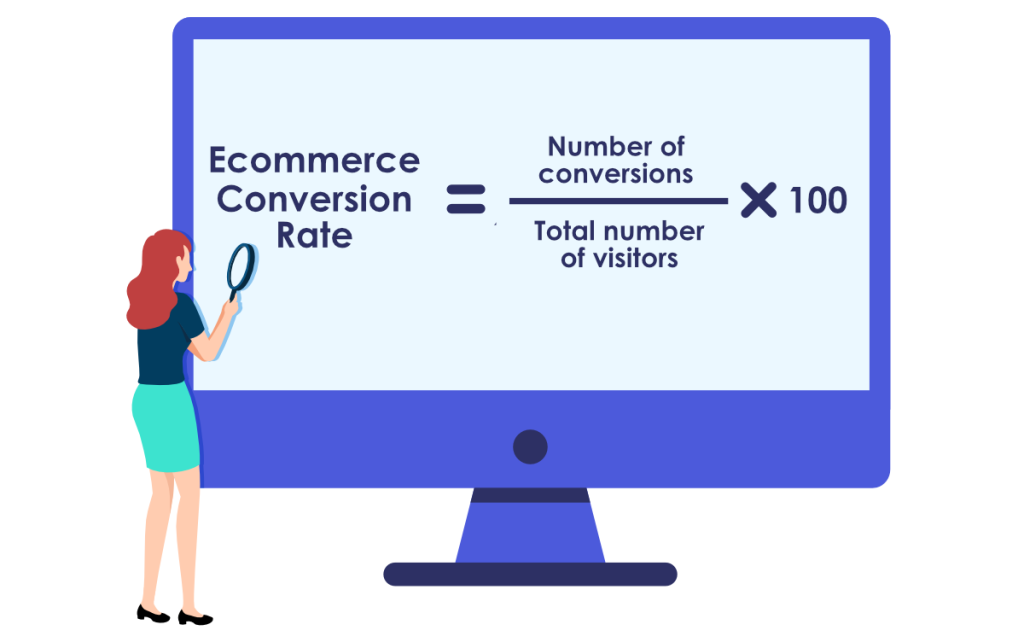
3. Conversion Rate
There are many conversion metrics you can track. Conversion or click-through rate is generally found by dividing the number of targeted shoppers by the number of them who took a desired action (i.e. clicked on a search result or added an item to their cart).
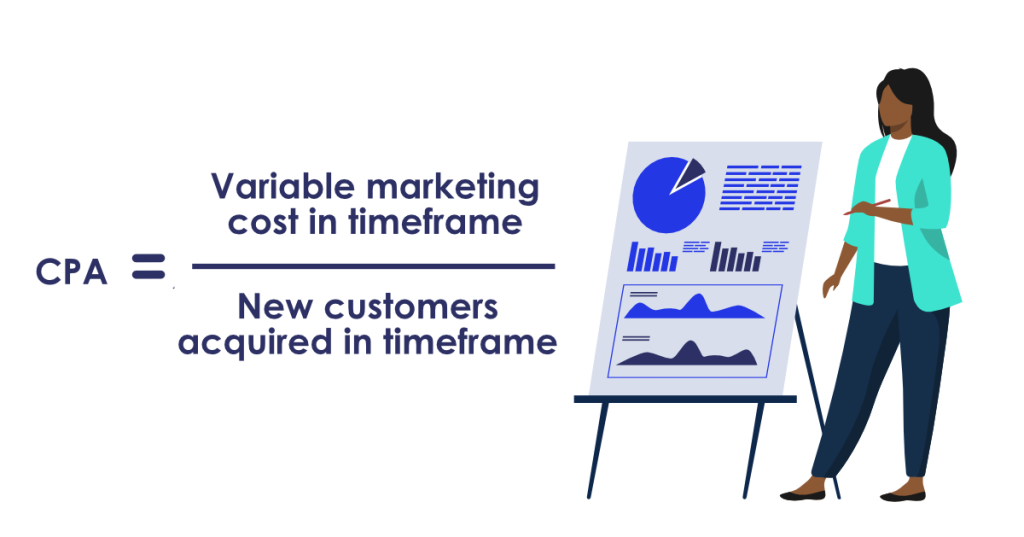
4. Cost Per Acquisition (CPA)
CPA is the cost of acquiring a non-paying visitor to your store. To find CPA, first calculate the cost of your marketing efforts (by channel, if desired). Then, divide it by the number of visitors to your store over a specific time period.
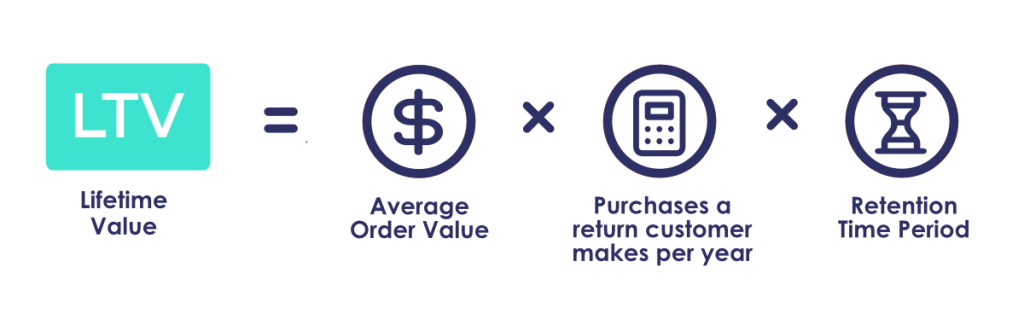
5. Customer Lifetime Value (CLV)
Customer Lifetime Value is an estimate of how much money a customer will spend during their entire tenure in your store.
Increasing the number of new customers is more expensive than retaining return visitors. Additionally, return visitors spend over 60% more money than first-time buyers, so this is an important metric to track.
If you want to increase CLV, you can start by creating customer loyalty programs and improving the user experience on your site. These optimizations may be time-consuming but can lead to significant increases in revenue.
6. Zero Result Rate (ZRR)
Zero Result Rate is the percentage of searches that lead to zero result search pages.
Zero result search pages often lead to frustration and cause shoppers to prematurely end their shopping journey. This is because shoppers think you don’t have what they’re looking for, even if you have the item in stock.
You can lower this number by implementing an effective search solution with a Rich Autocomplete that understands user intent and guides shoppers to desired results for every query.
While you can drastically lower ZRR with an optimized search solution, it is important to know that zero result search pages are inevitable. Check out this article to learn how to prevent frustration in your store and keep shoppers engaged.
7. Average Cart Abandonment Rate
Average Cart Abandonment Rate shows the percentage of shoppers who added items to their cart and left the store without making a purchase.
According to SaleCycle, Cart Abandonment Rate is much higher on mobile devices than on desktops, so it is important to pinpoint why shoppers aren’t completing their purchases to address this KPI.
A shopper may abandon their cart for many reasons:
- Shipping costs
- Item availability
- Difficult UI
Once you start tracking cart and checkout abandonment rates, you can target the specific causes and help alleviate shoppers’ pain points.
For example, you can acknowledge shoppers’ struggles during the add-to-cart process, address shipping costs, and take additional action you see fit.
8. Branded Online Search Impressions
Branded Online Search Impressions tell you how many people are searching for your brand online, organically, and across different channels.
This key performance indicator can be tracked via Google Ads (or another keyword tool like Wordstream or SEMRus) and used to show how effective marketing efforts are.
9. Customer Churn Rate
Customer Churn Rate is the percentage of customers who terminate their relationship with your business over a specific period.
You can calculate CCR with the following equation:
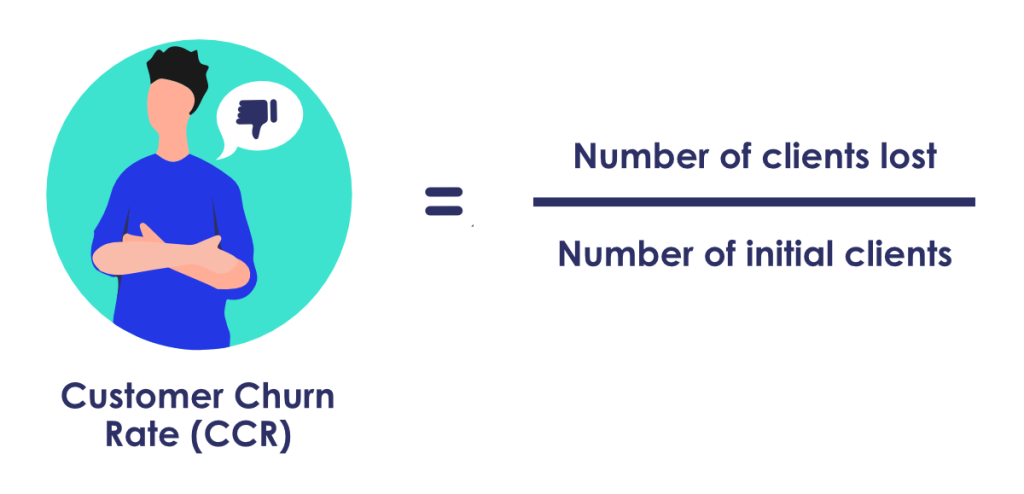
This KPI is important because customers with repeat visits to Ecommerce businesses generate more revenue over time than new shoppers who only make a single purchase in your store.
One way to lower your churn rate is to implement an advanced search solution. This will help shoppers find what they’re looking for more efficiently, create a positive brand image, and encourage repeat visits.
10. Gross Profit Margin
Gross Profit Margin is a strong indicator of your business’s health and performance.
To calculate Gross Profit Margin, use the following equations:
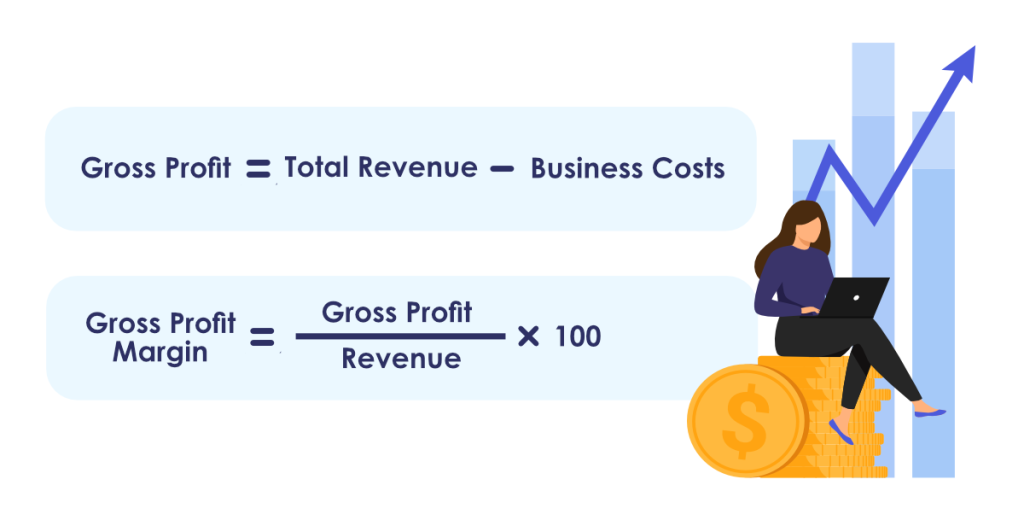
Generating a profit is one of the most important aspects of running a business, so this KPI is a very effective way to measure success.
11. Conversion Rate Per Traffic Channel
Tracking Conversion Rates Per Traffic Channel will help you discover which marketing efforts are most effectively bringing in business.
This KPI measures traffic volume and will help inform where your customers are coming from, which campaigns are most effective, and how to best allocate your budget.
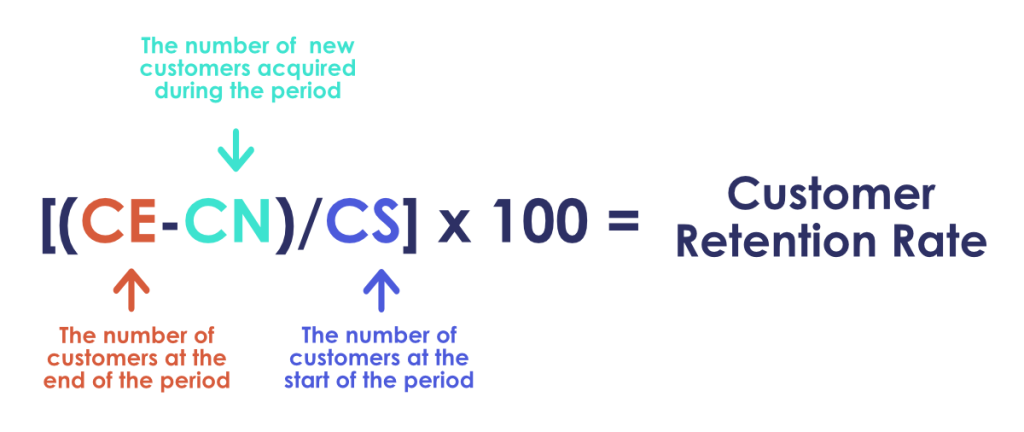
12. Customer Retention Rate (CRR)
CRR is the percentage of customers a business retains over time. Most revenue comes from repeat customers rather than first-time shoppers.
This KPI will help you understand what aspects of your Ecommerce store are encouraging repeat visits and what’s causing them to leave.
Pinpointing areas of your business that can be optimized for better retention rates can drastically increase revenue, so this KPI is crucial.
13. Add-to-Cart Rate
Add-to-Cart Rate tells you the percentage of shoppers that added an item to their cart.
This metric doesn’t track purchases. However, it can help you understand if the visitors in your store have come with a specific product in mind or if they’re browsing. It also shows how effectively your Ecommerce store was able to help shoppers find desired items.
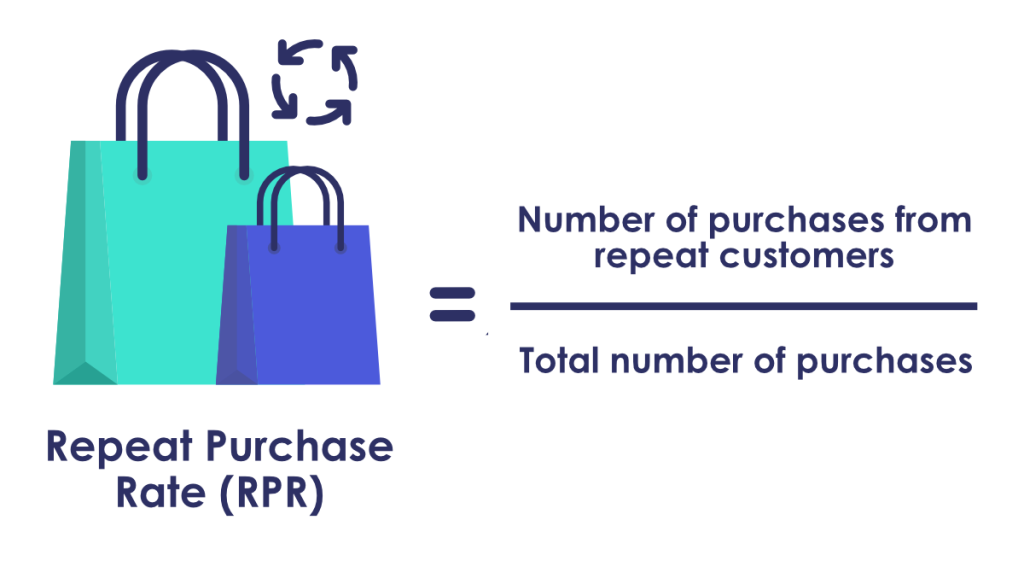
14. Repeat Purchase Rate (RPR)
Repeat Purchase Rate is the percentage of customers that return to your store to make a purchase.
This metric can help you discover how strong your customer loyalty is. This information can inform strategies that strengthen the impression of your brand.
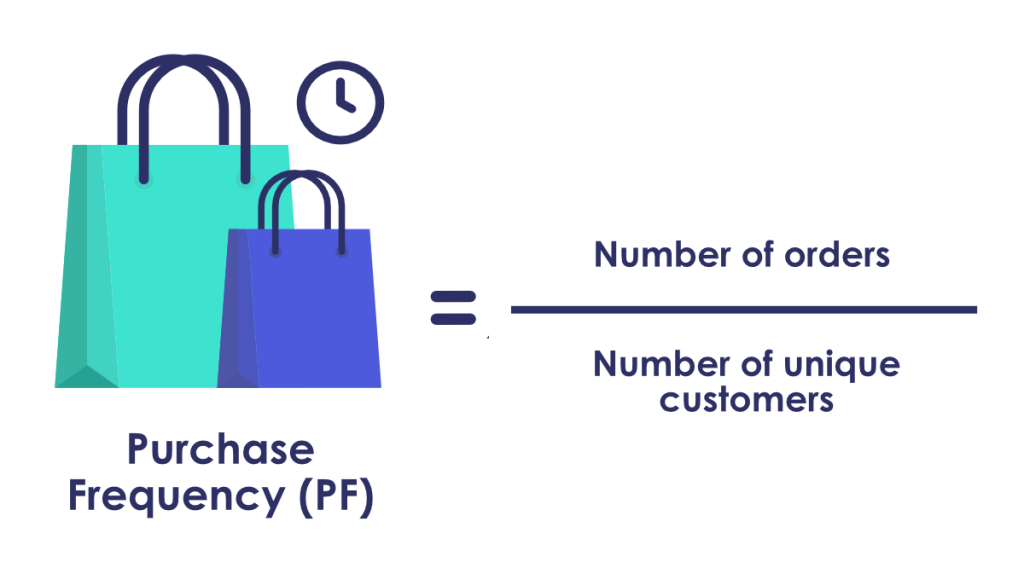
15. Purchase Frequency
Purchase Frequency measures the number of purchases shoppers make in your store over a specified period. This KPI can help you determine which products perform well and help you gauge customer loyalty.
16. Average Purchase Revenue Per Visitor
This KPI tells you how much revenue your Ecommerce store is making per visitor on average.
You can find this number by dividing total revenue by the total number of visitors in a set period of time.
17. Cost Performance Index (CPI)
CPI measures the cost efficiency of specific projects. It also shows if a project is performing well relative to its budget.
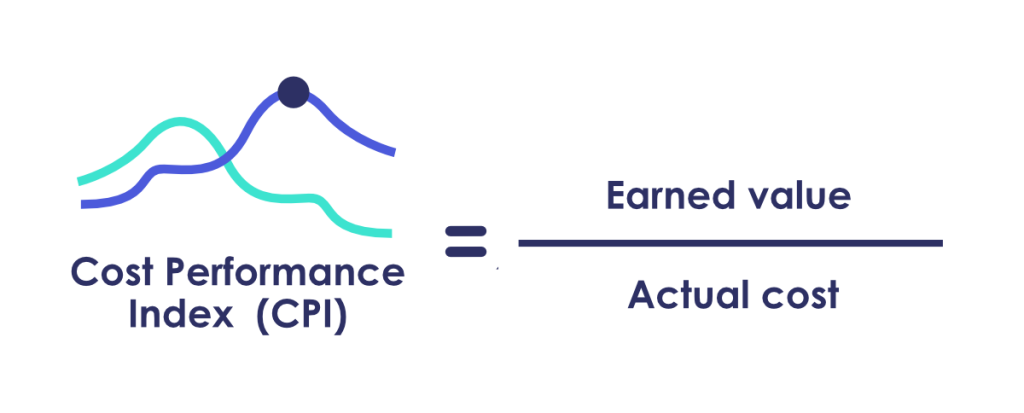
CPI is a great way to determine how effectively your spending is generating your desirable outcome.
18. Return on Investment (ROI)
ROI measures the efficiency and profitability of an investment.
Calculate ROI by dividing net profit by initial cost. This will help determine how quickly and effectively your investment generated a profitable outcome.
19. Return on Ad Spend (ROAS)
ROAS measures the amount of revenue generated from money spent on specific advertising efforts.
This KPI determines how your marketing spending efforts impact actual revenue.
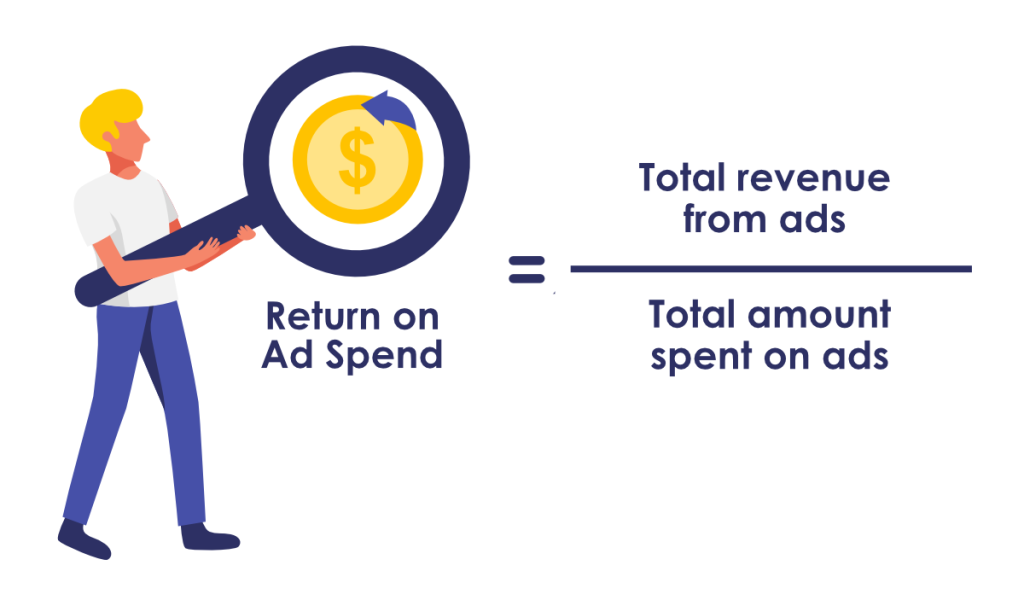
Track ROAS to ensure you’re not wasting your budget on channels that are losing money.
20. Email Signup Conversion Rate
This KPI measures the percentage of subscribers that opt into your sales funnel as a direct result of your email outreach.
Email campaigns are an effective way to target new sales prospects. There are many ways to create engaging email outreach campaigns; we recommend:
- Personalizing your email to the target audience
- Demonstrating you understand the recipient’s pain points
- Optimizing the content with relevant CTAs
When done correctly, tracking your email list growth rate and email click-through rate can be incredibly lucrative.
21. Website Traffic
Website traffic is one of the most important metrics to track. The number of people who visit your site directly impacts purchases and revenue.
Measuring the percentage of customers coming from social media posts, blog traffic, newsletter subscribers, or other channels can help you determine where visitors are coming from. Then you can use this information can to better target people who will most likely increase traffic to your store.
22. Time to Purchase
Time to Purchase tells you how long it takes a shopper to make a purchase. Depending on your industry, shoppers may visit your store many times before buying something. Or they may come once and purchase an item from your Ecommerce business immediately.
For example, in a Consumer Electronics store, shoppers often make repeat visits. They want to ensure they research a single product thoroughly before buying it. In this case, it may be best to make detailed product information easily accessible so shoppers can make confident purchases without leaving your store.
On the other hand, shoppers in online pharmacies often want to buy medicine quickly. Thus, it is best to provide them with reviews or pharmacy pick-up details to shorten the average purchase time.
Tracking this metric will help you understand your shoppers and make data-driven decisions to streamline their purchase journey.
23. Repeat Visits
Repeat visits include shoppers who continuously look at items when making a purchase decision and repeat customers looking to make another purchase.
If you notice many visitors coming to your store without buying anything, pinpoint where shoppers are terminating their journey. This will help you determine which part of your store to optimize.
And, if you have many repeat customers, that’s great! But don’t get complacent. Shoppers’ needs and habits change frequently, so it’s best to continuously enhance the customer experience to strengthen brand loyalty and encourage more repeat visits.
24. Bounce Rate
Bounce Rate shows the percentage of visitors who enter your store through a search engine or other referral source and leave without making a purchase. This metric indicates whether or not shoppers are finding the products they’re looking for in your store.
One way to lower your bounce rate is to focus on search engine optimization. An optimized search engine that leverages Machine Learning and AI is an effective way to help shoppers find items they want to buy.
Search engines that generate relevant recommendations, suggest popular products or product bundles, and provide accurate rankings will encourage repeat visits and decrease your store’s bounce rate.
25. Referral Traffic
By measuring Referral Traffic, your business can see which sources are sending the highest number of visitors to your site.
This metric can help you ensure you’re spending money on the most effective channels.
Now that we’ve gone outlined 25 useful Ecommerce KPIs, you probably have an idea of which ones you’re going to use. So let’s dive into our final question.
How often should you track your Ecommerce KPIs?
The frequency you check your KPIs depends on the specific metric you are tracking, as well as your individual business goals.
That said, we’ve outlined commonly used time frames that you can use as a guide.
Weekly Metrics
Ecommerce metrics that give insight into the day-to-day health of your business (impressions, social media networks engagement, website traffic, etc.) should be monitored weekly.
For example:
- Conversion Rate
- Website Traffic
- Sales
Bi-weekly Metrics
Metrics that require a larger sample size to offer an accurate picture are best checked bi-weekly.
- Cart Abandonment Rate
- Average Order Value
- Ad Campaign Performance
Monthly Metrics
Many KPIs are best tracked on a monthly basis for the most accurate results.
A few monthly KPIs include:
- Customer Churn Rate
- Email Signup Conversion Rate
- Conversion Rate per Traffic Channel
Quarterly Metrics
Metrics that determine business growth should be checked quarterly to ensure you have a clear sense of how your business is performing in relation to the goals you’ve set out to achieve.
For example:
- Customer Acquisition Cost
- ROI
- Gross and Net Profit Margins
Conclusion
Choosing the right Ecommerce KPIs for your business will be determined by your company’s objectives.
No matter which facet of your business you want to improve, we recommend choosing KPIs that establish concrete goals, are based on historical data, and collectively measure growth.
Once you decide which aspects of your business you’d most like to target and optimize, you can effectively narrow down the right KPIs and take actionable steps to maximize business performance for long-term success.

Rebecca is the Copywriter at Prefixbox, a leading Search and Discovery solution for Enterprise Ecommerce retailers. Originally from California, Rebecca works at Prefixbox’s office in Madrid.
